Trade is a useful barometer of economic vitality, as it is indicative of an economy’s competitiveness and societal preferences. Countries that develop their industrial and agricultural base export more products than countries that are less developed, with some going one step further by fostering an environment in which complex products can be produced and exported. As exports rise, countries can import more products that they do not produce domestically. By examining a country’s imports and exports, one can begin to understand more about its economy, business environment, consumer habits, and official trade policies.
Bearing these assumptions in mind, The Policy Initiative gathered and analyzed trade data to determine what it reveals about the current state of the Lebanese economy. As a merchant republic, Lebanon has maintained policies supportive of the free exchange of goods and capital since its founding. While the total value of Lebanese exports in recent years remained relatively low, about $4 billion, import bills expanded to reach $20 billion. In effect, Lebanon was living beyond its means and not generating enough dollars from exports to buy imported products. Instead of curbing imports or promoting exports, policymakers chose to attract capital from abroad to finance the difference and maintain an abnormal standard of living. Ensuing trade deficits and the budget deficits were the main causes of the 2019 financial collapse. Over the last four years, Lebanon’s GPD contracted to less than half of its 2018 level. The Lebanese pound lost more than 95% of its value, the commercial banking sector is effectively bankrupt, poverty soared, and income and wealth inequalities reached unprecedented levels.
This study aims to assess how trade has been affected by the economic and financial crisis. Generally, when a currency collapses, exports increase as products become relatively cheaper to sell abroad and imports decrease as they become more expensive. In most cases, as a trade deficit shrinks, demand for hard currency reduces. Accordingly, TPI chose to closely examine the effect of the financial and economic crisis on the value of both imports and exports between 2018 and 2022. Going beyond the aggregate numbers, we determine the composition of exports, not solely in terms of sectors and sub-sectors, but also how and to what extent products with comparative advantage have changed. We also focus on how complex products – which require a higher level of sophistication to make – evolved during this period. While product diversification is important, our work examines Lebanese export markets as well as the potential to export more products that are in demand worldwide. We also examine Lebanon’s import basket and assess how the types of goods in it, including basics and luxury products, have changed over the same period.
By analyzing luxury import trends, export patterns, market destinations, and product complexity, this study provides valuable insights into Lebanon's economic resilience and challenges facing the country. Such an analysis is crucial to understanding the broader socio-economic impacts of the crisis and informing policymaking and economic recovery.
The methodology employed in this report is rooted in a thorough analysis of trade data, supplemented by current economic indicators and historical trends. The key data sources include:
These data sources, combined with academic literature, industry reports, and financial market data, form the backbone of the analysis presented in the report. By leveraging these diverse data streams, the report offers a holistic and detailed picture of Lebanon's trade status during its economic crisis.
This report brings together five essential articles that examine changes in exports and imports over the years:
The first article assesses how Lebanon’s exports changed at the sectoral and product levels. Lebanon exported 936 products in 2022 worth $3.4 billion in real terms, marginally less than 948 products in 2018. “Plastics and Rubbers” exports increased by the most significant amount followed by “Vegetable Products”. The country added 77 new products to its export basket but stopped exporting 65 products during the same period. Lebanon has a comparative advantage in 203 products valued at $3 billion, which are mostly in the “Precious Metals”, “Metals”, “Plastics and Rubber”, and “Chemical Product” sectors. The first article assesses how Lebanon’s exports changed at the sectoral and product levels. Lebanon exported 936 products in 2022 worth $3.4 billion in real terms, marginally less than 948 products in 2018. “Plastics and Rubbers” exports increased by the most significant amount followed by “Vegetable Products”. The country added 77 new products to its export basket but stopped exporting 65 products during the same period. Lebanon has a comparative advantage in 203 products valued at $3 billion, which are mostly in the “Precious Metals”, “Metals”, “Plastics and Rubber”, and “Chemical Product” sectors.
The second article covers Lebanese export destinations. Lebanon exported 948 products to 171 countries in 2021. Compared to 2018, it lost 12 markets and gained eight new ones. The share of Lebanese exports to Europe rose from 22% to 25% between 2018 and 2021, whereas exports to Asia declined from 52% to 46%. Over the same period, Lebanon managed to expand its total trade by $1.6 billion to 11 countries worldwide, which include Cameroon, Egypt, and Liberia, among others, selling goods such as “Scrap Iron and Copper”, “Gold”, “Jewelry”, “Diamonds”, “Grapes”, and “Dried Fruits”. From 2018 to 2021, Lebanon lost seven markets worth $300 million, and Lebanon has thus far failed to capitalize on potential exports, comprising 22 products worth around $948 million, which could be sold to 20 markets including Switzerland, the UAE, Saudi Arabia, Egypt, and the USA.
The third article examines the complexity of Lebanese exports. In 2021, Lebanon exported 88 complex products – those that require sophisticated production processes – worth $151 million, compared to 90 such products worth $142 million in 2018. These products are distributed across nine sectors, predominantly in the “Machine”, “Metal”, and “Chemical Sectors”. Lebanon had a comparative advantage in 11 such products, including “Photographic Material”, “Blown Glass”, “Felt Machinery”, and “Electric Furnaces”. While their total value is small, they signal potential that has yet to be leveraged. These products are mostly sold in Africa and the Middle East.
The fourth article analyzes which imported goods have recovered the quickest amid the crisis. Lebanon’s import bill recovered from a low of $12.8 billion in 2020 to $19.5 billion in 2022. Imports across all categories suffered a significant decline in 2020. Luxury products, of which there are about 200, recovered the quickest, reaching $3.5 billion in 2022. Such products include large capacity “Spark-Ignition Engines”, “Electric vehicles”, “Jewelry”, “Gold”, “Diamonds”, as well as “Yachts and Pleasure Boats”. Consumer food products, on the other hand, stood at 68% of their pre-crisis level.
The fifth article examines the accuracy of reported data by Lebanon and its partners. Lebanon misreported its export data by an average of 46% between 1997 and 2022, which is astonishingly higher than other countries like France and Angola, which had misreported their data by 9% and 13%, respectively, over the same period. We show that Lebanon has consistently underreported its exports over the last 26 years, while it overreported its imports between 1997 and 2012 and underreported them between 2013 and 2022. Moreover, Lebanon has consistently underreported its exports to Switzerland, the UAE, and Kuwait, where “Precious Stones” accounted for the highest difference. Lebanon underreported data on “Precious Stones” imports from the UAE but overreported its trade with the USA, particularly “Mineral Fuels”.While this requires further investigation, the discrepancies could be attributed to a range of factors including trade data classification, tariff evasion, and economic changes.
While often considered a negative development, currency shocks can positively affect a country’s export-oriented sectors by giving them a competitive edge in global markets. One might therefore expect that despite a rapid onset of challenges and hardship for so many people across Lebanon, the country’s devalued currency has provided a boost to some of its productive sectors. However, understanding how the Lebanese financial crisis and currency devaluation has affected the export landscape remains a complex task. Despite some minor improvements at an aggregate level during the crisis period, these effects have been mixed and challenging to interpret.
Even though total Lebanese exports surged to $4.2 billion in both 2019 and 2021, they regressed to pre-crisis levels in 2022, when exports totaled $3.4 billion when adjusted for global inflation (Figure 1). While this may suggest that Lebanon is losing some of the competitiveness that it gained due to currency devaluation, it is necessary to examine how exports have evolved throughout the crisis to understand the broader impact of currency devaluation on various sectors and the economy, particularly in light of Lebanon’s de-facto dollarization policy.
This article aims to evaluate export trends by comparing them to pre-crisis levels, specifically by focusing on changes at both the sectoral and product levels, as well as alterations in the comparative advantage of Lebanese products. In doing so, we intend to provide insights that can guide policymakers and market participants by highlighting the genuine potential of Lebanese exports and situating them within the wider macro-economic context of recovery.
Source: Lebanese Customs Administration
Even though total Lebanese exports surged to $4.2 billion in both 2019 and 2021, they regressed to pre-crisis levels in 2022, when exports totaled $3.4 billion when adjusted for global inflation
exported product in 2018
exported product in 2022
Lebanon boasts a diversified basket of exports despite their modest volume. The country exported a total of 936 different products in 2022, only marginally less than the 948 products exported in 2018. These products can be grouped into 10 main categories, of which “Stone and Glass” (23%) and “Metals” (14%) have the highest share (Figure 2).
A Diversified Export Basket
Figure 2: Distribution of exports across sectors in 2022
Source: Lebanese Customs Administration
Despite marginal changes at the aggregate level between exports in 2018 and 2022, some significant changes can be observed across categories. Exports of “Plastics and Rubbers” increased by the most significant amount, rising by $177 million (an 85% increase compared to 2018), followed by “Vegetable Products” (increased by $67 million or 24%), and “Metals” (increased by $46 million or 10%) (Figure 3). Meanwhile, the country’s most significant category of exports, “Stone and Glass”, was unchanged.
Contrasting these categories, “Foodstuff” exports decreased by $56 million, marking the most pronounced decline (13%), followed by “Chemicals and Allied Industries”, which decreased by $53 million (27%)
Lebanon exported 77 new products in 2022 that it did not in 2018, which in total were worth $11 million. However, only 12 of these products were valued at higher than $100,000, making up 93% of the total. Notably, “Aluminium Powders and Flakes” and “Oil Cakes” (soybean livestock feed) comprised 70% of the total value of newly exported products. Meanwhile, Lebanon stopped exporting 65 products in 2022 that were part of its 2018 export basket, which together were valued at $69 million. The most valuable of these were “Lead Products”, “Live Sheep and Goats”, “Antiques Older than 100 Years Old”, and “Cement”.
Comparative advantage is both a function of local economic dynamics and international market trends. The Revealed Comparative Advantage (RCA) indicator highlights whether a country is particularly adept at making and selling certain products on the global market. RCA is calculated by comparing a country's share of exports in a particular product to the world's share of exports in the same product. If a country's share of exports is larger than its share in the world's total exports (RCA >1), it suggests a revealed comparative advantage in that product.
Lebanon had a comparative advantage in 203 out of its 936 exported products in 2022. For comparison, Lebanon had a comparative advantage in 216 out of 948 exported products in 2018. The value of high RCA products in both years stood at about $3 billion, or about 87% of total exports.
The highest concentration of RCA products in 2022 was in “Vegetables” (33 products), followed by “Foodstuffs” (25 products), “Chemicals and Allied Industries” (25 products), and “Metals” (25 products) (Table 1). The five products in “Precious Metals” totalled $750 million, accounting for 25% of the value of products with high RCA and include “Diamonds” ($436 million), “Gold” ($105 million), and “Articles of Jewellery” ($116 million). This was followed by products in the “Metals” sector with a value of $450 million (15%), which include “Ferrous Waste and Scrap” ($147 million), "Waste and Scrap of Copper” ($115 million), and “Waste and Scrap of Aluminium, Unwrought Lead” ($54 million). RCA Products in the foodstuffs sector were valued at $377 million (12.4%), including “Water” ($49 million), “Wine” ($30 million), “Sauce Preparation” ($51 million), “Fruits and Nuts” ($31 million), and “Bread and Pastry” ($21 million). Lebanon’s “Vegetable Products”, which amounted to $30 million and constituted 10% of the share, included “Potatoes” ($20 million), “Bananas” ($25 million), “Apples” ($47 million), “Grapes” ($47 million), “Apricots” ($30 million), and “Coffee” ($25 million).
Holding on to Lebanon’s Comparative Advantage
Table 1: Number, value, and share of products with RCA > 1 in 2022
Source: Lebanese Customs Administration and authors’ calculation
Notably, Lebanon lost its comparative advantage in products across nine out of the 15 sectors and gained a comparative advantage in four. In fact, Lebanon had a comparative advantage in 65 exported products in 2018 that by 2022 it was no longer producing, which in total were valued at $290 million (Figure 4). The value of new products in which Lebanon had a comparative advantage in 2022 shrank by $59 million, primarily comprising items from the “Wood, Plastic and Rubber”, “Animal Products”, and “Machinery and Equipment Sectors”.
Figure 4: RCA in 2018 and 2022 across sectors
Source: Lebanese Customs Administration and authors’ calculation
The impact of the financial crisis on exports is not straightforward. The devaluation of the currency did not lead to a surge in the number or volume of exports. However, it did change the composition of exports where value of products in the “Plastics and Rubber”, “Vegetables” and “Metals” sectors increased while that of products in the “Foodstuffs” and “Chemical and Allied industries” decreased. Although Lebanon exported 77 new products in 2022, it also stopped exporting 65 products in the same year. The country managed to maintain its comparative advantage in 203 out of 936 products across several sectors including “Precious Metals”, “Metals”, “Foodstuffs”, and “Vegetable products”. The inability of the country to expand its comparative advantage is indicative of a structural challenge within the Lebanese economy. These findings underscore the need for a strategic approach to enhancing production capacities, quality standards, and market access. Focused interventions in high-potential sectors could help Lebanon rebuild a more resilient and competitive export sector, which are essential to its economic recovery and sustainable growth.
Lebanon’s financial and economic crisis has left no sector untouched, triggering a range of market disruptions and transformations. A confluence of factors including dwindling capital flows, constricted credit markets, and reliance on imported raw materials has adversely impacted the country’s productive sectors. On a more positive note, Lebanese pound devaluation made the country’s exports more competitive domestically and internationally, yet the exact changes in Lebanon’s export landscape are not well understood beyond slight increases in their total volume. In this article, we assess how markets for Lebanese products have changed in recent years by comparing trade statistics from 2021 to trade statistics from 2018. 1
Lebanon exported 948 products to 171 countries, spanning six continents in 2021. In comparison to 2018, Lebanon lost access to eight markets, resulting in a loss of approximately $12 million in export value across them. Exports to the Democratic Republic of Congo dropped by the most significant amount, about $11.5 million. During the same period, Lebanese products were able to penetrate new markets, including Cocos, Turkmenistan, Cuba, Curacao, the Cayman Islands, the British Virgin Islands, Cook Island, and Surinam, contributing $2.3 million to export receipts in 2021. Notably, the British Virgin Islands emerged as a prominent player, accounting for $1.4 million of these new exports.
The geographical distribution of Lebanon's exports transformed between 2018 and 2021, when the share of Lebanese exports to Europe increased from 22% to 26%. Trade with North America also grew, climbing from 3% to 5%. By contrast, exports to Asia declined from 52% to 46%, underscoring shifts in global trade relationships (Table 1).
Table 1: Value and share of Lebanese exports by continents
Source: The Observatory of Economic Complexity and authors’ calculations
Beyond the aggregate numbers, a closer examination of the data reveals intriguing insights. Lebanon expanded its trade by a staggering $1.6 billion to 11 countries worldwide from 2018 to 2021 (Table 2). Countries such as Cameroon, Egypt, Liberia, the UAE, Bangladesh, Cyprus, South Korea, Switzerland, Greece, Portugal, and the USA increased trade with Lebanon over that period. 2
Table 2: Increase in the value of Lebanese exports to selected countries
Source: The Observatory of Economic Complexity and authors’ calculations
Notable Shifts in Export Patterns
Among other notable changes in Lebanon's trade relationships are increases in specific exports to particular countries. For example, while the number of products exported to Cameroon decreased from 341 in 2018 to 250 in 2021, the category "Other Furniture" stood out, surging from $48,000 in 2018 to a staggering $274 million in 2021. Similarly, exports of "Scrap Iron" to Egypt played a significant role in driving up total exports, rising from $12 million in 2018 to $186 million in 2021. Greece also displayed an upward trend in purchasing similar goods, with “Scrap Iron” imports increasing from $26 million in 2018 to $180 million in 2021. Lebanon's exports of “Scrap Copper” also grew, reaching $32 million in 2021 compared to almost $18 million in 2018. Lebanon's exports to Switzerland also expanded, largely in products under the category "Gold", which surged from $108 million in 2018 to $410 million in 2021.
Increased trade with the UAE and US was characterized by greater product diversification. Lebanon expanded the diversity of its exports to the USA from 335 to 354 products. Notable examples include “Sauces and Seasoning”, the value of which grew from $3.8 million in 2018 to $12.5 million in 2021; “Jewellery” from nearly $13 million to $52 million; and “phosphatic fertilizer” from zero to $28 million. Lebanon introduced 43 new products to its UAE export portfolio and significantly expanded its exports in nine existing product categories between 2018 and 2021. “Diamond” exports rose from $272 million in 2018 to $417 million in 2021, “Jewellery” from $22 million to $65 million, “Gold” from $714,000 to $20.5 million, “Grapes” from $1.4 million to $137 million, and “Dried Fruit” from $14,000 to $10.5 million.
Lebanon was also faced with substantial export declines (Table 3), 3
Table 3: Decrease in the value of Lebanese exports to selected countries
Source: The Observatory of Economic Complexity and authors’ calculations

Capitalizing on Untapped Markets
Amid these fluctuations, certain products like “Gold, Unwrought, for Non-Monetary Purposes”, “Jewelry”, “Fresh apples”, and “Grapes” appear to have untapped potential (Figure 1). The variance in value between potential and actual exports of these goods implies that Lebanon has the potential to export an additional $948.5 million worth of these goods. 4
Figure 1: Products with export potential based on 2021 data ($ million)
Source: International Trade Center
As the dust settles on Lebanon’s shifting export landscape, several markets stand out for their unrealized potential (Figure 2). The UAE, Switzerland, and Egypt lead the pack (Figure 2), each boasting substantial room for additional exports. Lebanon possesses significant untapped export potential across various product categories. “Gold”, with a potential value of $346 million, could be exported primarily to the UAE ($173 million), Turkey ($37 million), and Saudi Arabia ($22 million). Similarly, there are potential markets for “Jewelry”, valued at $184 million, in Switzerland ($112 million), Qatar ($21 million), and Iraq ($15 million). “Fresh Apples” could be a lucrative export product with $48 million in potential sales, particularly to Egypt ($18 million), Syria ($4.9 million), and Iraq ($3.3 million). Lebanon also has significant export potential in “Bananas”, “Wooden Furniture”, “Generating Sets”, “Grapes”, and “Medicinal Products”, suggesting there is a diverse range of opportunities across different markets.
Figure 2: Lebanon’s untapped potential markets for their respective products ($ million)
Source: International Trade Center and authors’ compilation
Considerable attention is paid to the volume and nature of goods Lebanon exports in relation to the country’s imports, trade balance, and other macroeconomic indicators. In our previous article, TPI examined the number and types of products that Lebanon has a comparative advantage in selling to global markets, both before the onset of and during Lebanon’s interwoven crises. In this article, we assess the complexity of Lebanese exports
Complex products comprise those requiring sophisticated processes to build them. Their production is often associated with highly skilled and productive labor and capital-intensive processes operating in an environment with strong institutions. Often, these conditions are found in a limited number of countries. 1
Little effort is focused on Lebanese firms’ abilities to produce and sell complex products. Studies have shown that complex products are highly correlated with higher GDP per capita and lower levels of income inequality. They tend to pave the way for future growth and create high-paying and skilled jobs. Products like “Machines and Appliances for Specialized Industries”, “Instruments and Appliances for Physical or Chemical Analysis”, and “Appliances Based on the Use of X-ray or Radiation” are considered highly complex products. This contrasts with “Crude Oil”, “Cotton”, “Cocoa Beans”, or “Sesame Seeds”.
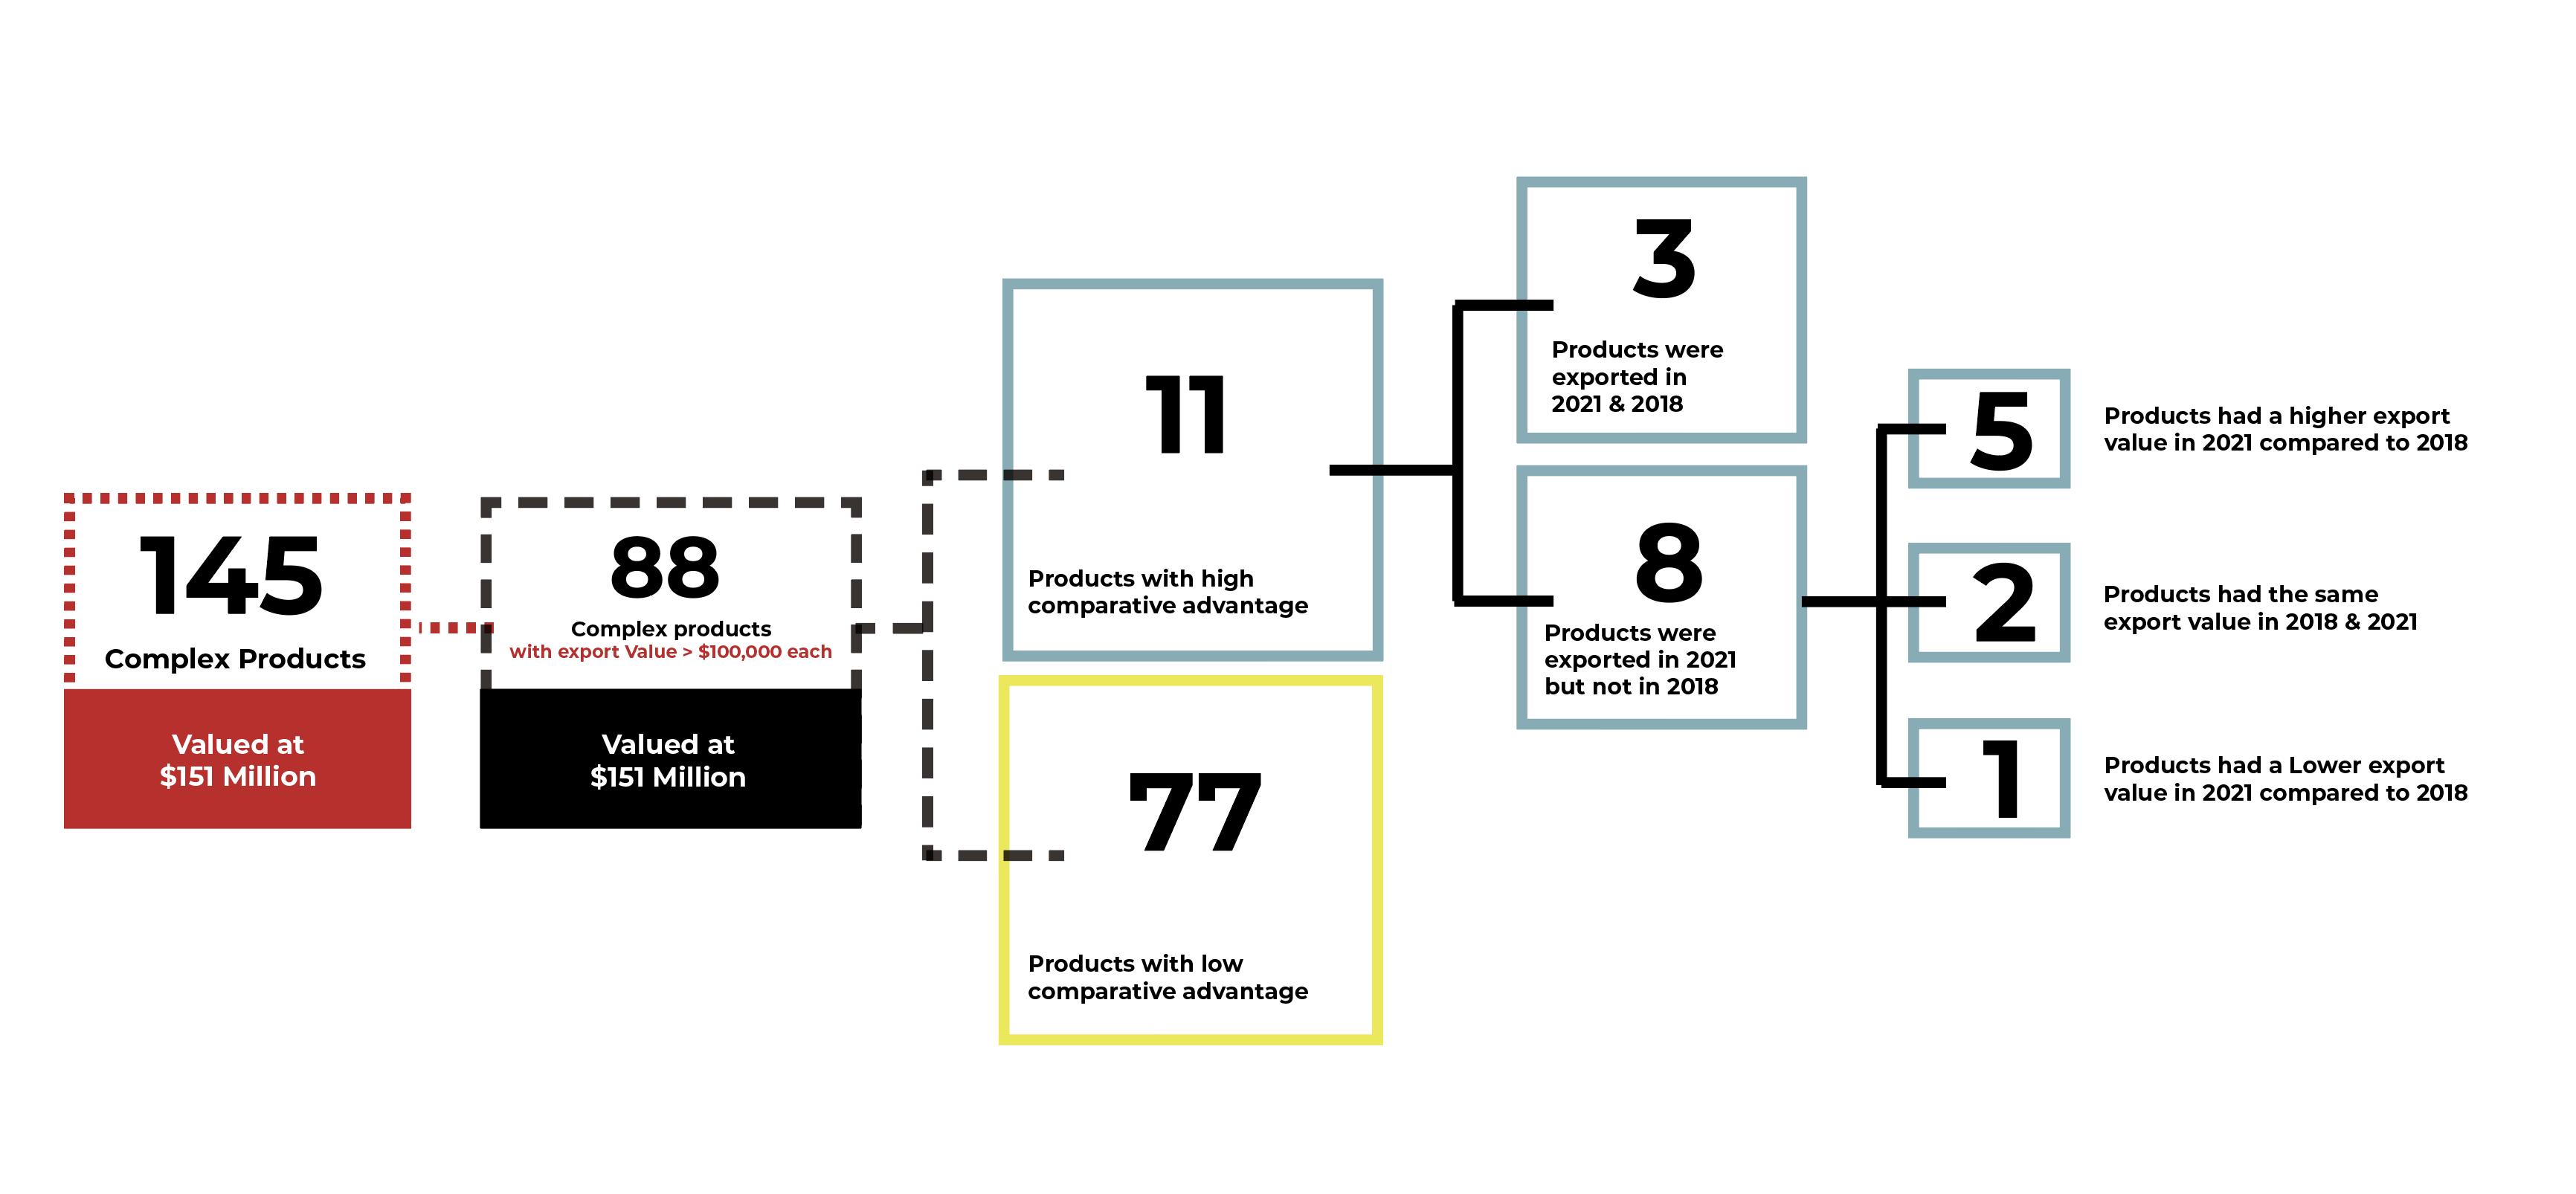
In 2021, Lebanon exported 145 products that are classified as complex (having a product complexity index greater than 1 for a scale that ranges between -2.5 and 2.5) and were valued at $151 million. By excluding products that do not have an export value exceeding $100,000, the number of complex products is reduced to 88, but their value remains at $151 million, meaning 57 complex products were exported in very small amounts. Looking at 2018 data, Lebanon exported 90 complex products (among those that exceed $100,000) with a value of $142 million.
Among Lebanon’s 88 complex products in 2021, 47 are classified as “Machines”, 12 as “Metals”, seven as “Chemicals”, six as “Stone and Glass”, six as “Instruments”, four as “Plastics”, two as “Textiles”, two as “Paper Goods”, one as “Weapons”, and one as “Miscellaneous”. Lebanon had a comparative advantage in 11 out of the 88 products when measured by revealed comparative advantage (above 1). These products, which were valued at $39 million, are mostly in the “Machines”, “Stone and Glass”, and “Chemical” sectors (Table 1). While their total value is small, they signal potential that has yet to be explored and leveraged
Table 1: List of complex products (PCI >1) with high RCA (>1) in 2021
Source: International Trade Center and authors’ compilation

Three out of the 11 products – “Developed Export Photographic Material”, “Blown Glass”, and “Felt Machinery” – were exported in 2021 but not in 2018. The remaining eight were exported both in 2018 and 2021. Out of these eight, one product, “Lifting Machinery”, declined in trade volume from $10.4 million to $8.3 million, “Electric Furnaces” and “Cast or Rolled Glass” had the same trade volume. The other five products experienced a big jump in sales. For instance, “Other Hand Tools” increased from $231,000 in 2018 to $2.5 million in 2021. In 2021, Lebanon exported most of its complex products to Africa and the Middle East. “Electric Furnaces” were exported to Saudia Arabia, Canada, and Oman; “Other Hand Tools” sold to Congo, Cote d’Ivoire, and Spain; “Paper Making Machines” exported predominantly to Nigeria; “Motor Working Tools” sold to Ghana, Cote d’Ivoire, and Togo; “Self Adhesive Plastics” exported to Syria, Saudi Arabia and Egypt; “Other Paper Machinery” sold to UAE, Nigeria, and Egypt; and “Lifting Machinery” exported to Algeria, Congo, and Cyprus.
Despite exporting complex products, Lebanon’s ability to make headway in expanding its roster of complex products seems limited. This is largely due to the country’s economic structure. The available knowledge and know-how, as well as the right environment and institutions to produce new complex products, is largely absent. Using the diversification frontier developed by the Observatory of Economic Complexity, the products that are “near” the current exported products are of low complexity. Products that have high “relatedness” to complex Lebanese exports, meaning those which Lebanese firms likely have the ability and capacity to produce, are also of low complexity.
While Lebanon has continued to export complex products amid its interwoven crises, the country's potential to expand its range of complex products is hindered by its economic structure, a limited industrial environment, and a lack of necessary institutions and knowledge. For Lebanon to enter the fray and produce more complex products, it must develop an industrial policy that fosters an environment in which knowledge and institutions can be utilized by industrialists and entrepreneurs to diversify and produce more complex products. This strategic shift is essential for Lebanon to elevate its position in the global market and drive economic growth through more sophisticated exports.
Amid one of the deepest financial and economic crises in modern history, there is a prevailing notion that the Lebanese economy is, to one degree or another, readjusting. Bustling streets and fully booked luxury establishments may contribute to this perception of normalcy, though it is vital to not exclusively rely on visual cues or macro-economic indicators like tourism revenues and GDP growth when evaluating economic and social outcomes.
The narrative of readjustment and stabilization has gained traction in public discourse, bolstered by commentators and public personalities on national media. However, a closer examination reveals that this supposed readjustment has only benefited a narrow social class comprising Lebanon’s most wealthy, allowing them to return to their pre-crisis consumption habits. In stark contrast, most of the population struggles to meet even their basic needs. Perhaps the most dangerous characteristic of this professed readjustment is that it can be maintained and will eventually lead to a transmutation of the Lebanese economy, society, and politics.
One key facet of the Lebanese economy is import dependence, highlighted by the fact that an estimated 80% of the country's food needs are covered by imports. Using import data as a proxy for consumption behavior offers a broad understanding of most residents’ expenditures on goods, painting a much grimmer picture than other indicators.
This article offers an empirical analysis of Lebanese society's consumption behavior during the crisis, focusing on luxury good import trends compared to other essential commodities, and benchmarking them against pre-crisis levels. By highlighting this issue, this article aims to offer a more comprehensive understanding of how residents fare in Lebanon’s contemporary economy and stimulate a deeper discussion about needed steps to ensure an inclusive and sustainable recovery.
Lebanon’s import bill recovered from a low of $12.8 billion in 2020 to $19.5 billion in 2022 (Figure 1). 1
Figure 1: Total imports ($ billion)
Source: Lebanese Customs Administration
This recovery does not indicate a broad re-adjustment of the economy but rather a narrow readjustment benefiting the country's wealthiest classes. Examining the composition of Lebanon’s import bill and distinguishing between three different categories – luxury (including “Vehicles”, “Gold”, “Jewelry”, “Cigars”, etc.), petroleum, and consumer food (excluding high-end foods) – reveals a significant disparity in the pace of recovery. TPI coded import data from the Lebanese Customs Administration according to the global Harmonized System, a standardized numerical method of classifying traded products. Luxury products are identified using the list of "luxury goods sanctions against Russia and Belarus and Russian and Belarusian oligarchs and malign actors," which includes the HS codes of more than 200 sanctioned products. Additionally, other significant import categories, such as petroleum products and food, are identified through manual categorization.
Imports across all categories suffered a significant decline in 2020, though luxury products recovered the quickest. Adjusting for inflation, luxury consumption grew by 64% year-over-year in 2021 and another 40% in 2022, totaling about $3.5 billion in that year (Figure 2). Luxury imports in 2022 were the second highest over the previous 10 years. Meanwhile, consumer food product imports, excluding high-end foods, decreased by 20% in 2020, followed by another 10% in 2021, and only recovered by 8% in 2022. This is the slowest rate of recovery across all categories. Total food imports in 2021 stood at $1.5 billion, accounting for about 40% of the country's luxury imports. The value of imported petroleum also significantly decreased in 2020 and 2021, possibly due to the pandemic and a large decrease in global prices, though it rose by 36% in 2022 to reach its pre-crisis average.
Figure 2: Change in imports across categories and time
Source: Lebanese Customs Administration and authors’ categorization
Overall, the value of luxury and petroleum product imports completely recovered to pre-crisis levels in 2022, while consumer food imports stood at 68% of their pre-crisis levels (Figure 3). Import substitution could play an important role in the slow recovery of imported consumer foods but this effect is expected to be constrained, as the substitution potential of the domestic agrifood sector suffers from competitiveness losses driven by near full dollarization of the economy.
Figure 3: Imports relative to pre-crisis average across categories and time ($ billion)
Source: Lebanese Customs Administration and authors’ categorization
The recovery in luxury goods has been driven by large increases across 10 main products listed in table 1, which totaled about $3 billion in 2022. These include large capacity “Spark-ignition Engine(s)”, “Electric Vehicles”, “Jewelry”, “Gold”, “Diamonds”, and “Yachts and Pleasure Boats”.
Table 1: List and value of luxury products
Source: Lebanese Customs Administration and authors’ categorization
Moreover, consumption of luxury products also seems unrelated to broad-level economic activity. Unlike total imports and consumer foods, changes in the consumption patterns of luxury products seem to be uncorrelated to GDP growth (Figure 4)
Figure 4: Change in imports and GDP across time
Source: Lebanese Customs Administration and World Bank
These findings, seen against the backdrop of broader socio-economic conditions, reveal the true scale of the widening gaps between income groups in Lebanon. Thirty percent of the Lebanese labor force is unemployed and more than half of earners have a monthly income of less than $200, while only about 3% earn more than $1,000. Moreover, the country's formal social protection system has collapsed, leaving most of the population exposed to the devastating impact of the crisis. Compounding this, the country is cash-strapped, with a lingering balance of payments deficit of $3 billion in 2022, meaning that imported luxury items are competing with other more essential products for remaining foreign currency in the country.
Finally, the collapse of the national currency and adoption of an official exchange rate for tax payments and tariffs means the state is effectively subsidizing the consumption of imports. Consequently, the treasury has lost billions of dollars in potential revenues from taxing imports since the onset of the crisis, which could have been used to bolster national social protection systems and cushion the impact of the crisis on society.
The semblance of normalcy reflected in the data presented above comes at grave social and political cost. Increased capacity to consume luxury goods today, compared to pre-crisis averages, means that a segment of society has not only been able to adapt to the crisis but also benefit from it. These include large winners from arbitrage opportunities enabled by ill-thought-out subsidies and distortions in the currency market, individuals who transferred their money abroad unethically and illegally, as well as large monopoly owners across sectors who have benefited from significant deductions on their borrowings from the financial sector due to currency devaluation. As such, the political class, through their capture of state institutions, has been able to maintain the interests of elities. As it stands, their economic and political resources will increase, yielding a society with a severely lopsided distribution of political and economic power.
Trade data is useful in determining the competitiveness of an economy and societal preferences, assuming it is both up to date and accurate. This article offers a preliminary assessment of how accurate Lebanese import and export data is by comparing it with data collected by Lebanon’s major trading partners. An analysis of 26 years of Lebanese trade data reveals striking anomalies, revealing substantial discrepancies in both export and import figures when compared to trade partners' data.
Lebanon exported product in 2010
Registered by Switzerland
Million Discrepancy
In 2010, a typical year in terms of discrepancy level, Lebanon reported that it exported $502 million in goods to Switzerland, but Swiss import data registered only $182 million in goods arriving from Lebanon, resulting in an apparent discrepancy of $320 million. Zooming out, reporting discrepancies with Lebanon’s 10 largest export markets in 2010 totaled $918 million in absolute value, which is a significantly high number given that registered exports totaled about $2 billion in the same year. When calculated for all years between 1997 and 2022, the discrepancy between Lebanon’s reported exports to its top 10 markets and their reported imports from the country averaged about 46%, reaching a high of 106% in 1997 and a low of 13% in 2020. This is a strikingly high level when compared to import and export data from France and Angola – a developed and a developing economy – which have an average discrepancy of 9% and 13%, respectively, over the same period.
Figure 1: Percentage of misreported exports to total recorded exports for Lebanon, France, and Angola
Note: The share of misreporting in absolute value is calculated based on the top-10 largest markets to which these countries export. Source: United Nations Comtrade
By comparison, Lebanese import data appears to be more accurate than export data. The discrepancy holds at 22% of the country's total import bill, half of the misreporting error on the export side. Moreover, this level is in line with France, which has a 24% discrepancy rate, and is lower than Angola’s 32%.
Figure 2: Percentage of misreported imports to total recorded imports for Lebanon, France, and Angola
Note: The share of misreporting in absolute value is calculated based on the top ten largest markets from which these countries imported. Source: United Nations Comtrade
Export data discrepancies in particular call into question Lebanon's data reporting reliability. Both import and export data discrepancies hint at possible underreporting or overreporting, which could be driven by factors such as attempts to evade tariffs, manipulate trade figures, or limitations in accurately tracking and recording trade transactions. One factor that could explain why Lebanon’s export data shows a much higher discrepancy rate than its import data could be due to how the data is recorded. For instance, import data is recorded by customs authorities in an importing state and attributed to the country from which imports directly arrived, while exports are recorded once they reach their final destinations, which in most cases does not account for re-exports.
Having established that there is a discrepancy in Lebanese export data, we then sought to determine how Lebanon is overreporting or underreporting its trade data. A comparison of Lebanese trade statistics and trade partner statistics yields two key findings. First, Lebanon has underreported its exports for most of the studied period with an average of 34% higher than reported in importing countries. Second, unlike exports, import data exhibits two distinct patterns. Lebanon overreported its imports on average by 13% between 1997 and 2012 but underreported it by 9% on average between 2013 to 2022. This coincides with the period in which Lebanon first recorded a balance of payment deficit over two consecutive years, calling into question how economic policies, market conditions, or changes in bureaucratic trade data collection affect the collection of trade statistics.
Figure 3: Lebanon’s yearly export and import discrepancy (under and over reporting)
Note: The data above zero indicates overreporting while that below zero indicates underreporting. Source: United Nations Comtrade
We then sought to determine whether trade data discrepancies are driven by a specific country. Lebanon consistently underreported its exports to Switzerland for 26 years to the tune of $2.7 billion, which comprises 36% of the total discrepancy over the studied period (Figure 4). The UAE and Kuwait followed with $1.1 billion and $1.3 billion, respectively, jointly accounting for another 29%. We also examined whether the discrepancy with these countries is specific to a certain year or across the board. Lebanon recorded its highest export discrepancy with Switzerland in 19 out of the 26 years, followed by the UAE in three years, and Korea and Kuwait in two years each. Accordingly, the total difference in exports was mainly skewed due to reporting patterns with the Swiss market. Looking deeper into the data, specific products appear to be key drivers of this discrepancy. In 2021, “Precious Stones” accounted for the highest discrepancy between Lebanese export and Swiss import data, totaling $30 million. In the same year, “Precious Stone” accounted for the highest discrepancy with the UAE totaling $140 million.
Figure 4: Volume and share of the export discrepancy between Lebanon and its top 10 export partners ($ billion)
Source: United Nations Comtrade
Over a 26-year period, Lebanon underreported imports from the UAE by about $10 billion and from Switzerland by about $1.5 billion. Notably, Lebanon overreported imports from the USA by $5.7 billion, China by $2.3 billion, and Germany by $3.3 billion over the same period. These five countries accounted for 76% of the total discrepancy. This demonstrates that import discrepancies are not driven by one specific country. Lebanon recorded the highest discrepancy in reported imports with the UAE for nine years, China for seven years, and Switzerland for five years out of the total period. “Precious Stones” and “Mineral Fuels” accounted for the largest import discrepancies in 2019, including $398 million worth of “Precious Stones” imported from the UAE and $490 in “Mineral Fuels” imported from the USA.
Figure 5: Volume and share of the import discrepancy between Lebanon and its top 10 import partners ($ billion)
Source: United Nations Comtrade